(Domestic) NET Metering Solution
So what is NET metering ?
It is the ability to measure power/energy
- Generated (for solar/wind)
- Used ie how much the home consumes (That used to be easy!)
- Exported back to the grid (basically = Generated – Used)
NET metering is really of value where there is some generation on site such as a wind or solar PV. When these new investments are connected to the grid NET metering helps you keep on top of your usage and figure out how your big investment is doing along with tracking your new energy buying and selling profile. Even better to be web based rather than hiding on those dials in the meter closet.
How can this be done ?
Measure Home meter power and the Generated power. The measurements should be capable of totalising directional (polarised) energy flows and take account of power factors to give useable information.
Why ?
Well usually the inverters used by solar/wind give generated numbers and the utility supply meter usually only gives bought energy. The inverter interfacing can get complicated and is different for all the various types.
What Information is useful to know?
Basic stuff usually financial accounting reports or graphs like
- How much £/$ has renewable generation made today/week/month etc
- How much energy is consumed. Are we still reducing our carbon footprint ?
- How much solar energy are we consuming/exporting.
Again a green self-sufficiency angle and a costing exercise
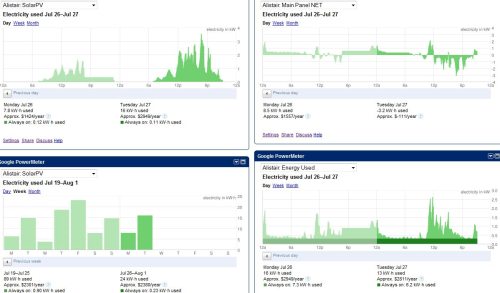
It also helps if you can casually flick to your browser and look at this information in a simple way just like this Google Power Meter screenshot.
How did I do it ?
Well it sounds like a product recommendation and it is. The Brultech ECM1240 companion software has a NET metering configuration option. Flick it on and bingo all the fancy directional energy flows are measured and posted off to google or a local dashboard. Pretty neat.
Filed under: Home, Industrial | 4 Comments
Tags: Energy Saving, Solar


I’m thinking of installing this net metering system also.
Does the ECM1240 software provide good printouts of daily and monthly energy in, energy out, and consumed energy? Or are the GooglePowerMeter printouts better ?
Personally the google powermeter for me nowadays is more convenient and the daily/weekly/monthly roll ups serve my needs well.
Brultech has a web dashboard and standalone application both in beta that also provide various time spanned totals/comparisons/reports. If you want tailored custom reports then you can feel free to access the underlying sqlite database that the Brultech ‘engineG’ program dutifully populates.
I also think that it is likely Brultech will improve the software visualisation support for ‘Net metering’ on the reasoning that the net metering support has been added fairly recently and it takes time to trickle through user driven improvements to the software presentation.
Hey!!
Im working on a proyect and I need to do something really similar.
I have already installed the Brultech 1240, but I need to manipulate that information into another software, can you help me with that? In which program can I work on that? How can I get the data from the brultech 1240 and make my own graphs or data conversion based on that?
Thank you so much!!!
If you are using the free EngineG software then it stores the records in sqlite3 database file. You can either regularly copy the file or try the ODBC driver for this to enable you to use what sql db graphs/charts you want.
If this doesn’t suit there are a number of 3rd party apps who have python scripts that you could tweak to get the records into whatever database you prefer etc